Predictive analytics tools are the starting point to understand and use your business data to help you see what the future holds. These solutions help you leverage historical (and current) data to understand trends, forecast revenue, and optimize marketing strategies. Use your data to reach more customers, provide them with the offers and products they need and want at the right time, carry out strategic enterprise planning, and increase revenue growth.
In this guide, we’ll break down the nine best predictive analytics platforms on the market today so you can decide on the right one for you and your business goals.
| Predictive analytics platform | Key features |
|---|---|
| Pecan AI |
|
| Qlik Sense |
|
| SAS Viya |
|
| Oracle Crystal Ball |
|
| Alteryx |
|
| IBM SPSS Statistics |
|
| DataRobot |
|
| SAP Analytics Cloud |
|
| Tableau |
|
What are predictive analytics tools?
Predictive analytics tools are specialized solutions that automate the complex statistical work required to forecast events. Think of tools for predictive analytics as the engine for modern data strategies, transforming raw, historical information into actionable probability scores. While the underlying math involves regression, decision trees, and neural networks, the software abstracts these complexities into accessible dashboards and workflows.
Our co-founder and CEO, Zohar Bronfman, explains what you might look for in a predictive analytics platform for your business:
“Keep in mind: predictive analytics tools aren’t prophetic. They can’t offer guaranteed outcomes. What they can do is offer reliable probabilities of results. As a single part of the greater advanced analytics game, predictive analytics uses statistics and machine learning to forecast a specific event’s likelihood. While mathematics and data science are the building blocks of the concept, many modern predictive analytics platforms, like Pecan AI, don’t require users to be data scientists.”
The best predictive analytics for revenue growth are like a well-tuned engine: powerful under the hood, but smooth and simple to drive. You get all the advanced features data scientists love, with an interface that makes sense for everyone else, so your team can make smart decisions and keep your growth on track.
9 best tools for predictive analytics
Predictive analytics solutions are gaining their space in daily business operations. According to Precedence Research, the global predictive analytics market will top $21.24 billion by 2026, with software solutions making up more than 60% of that. By bridging technical data science and business leadership, these platforms enable teams to advocate for decisions based on likelihoods, not just guesses.
Explore the nine best predictive analytics tools.
1. Pecan AI
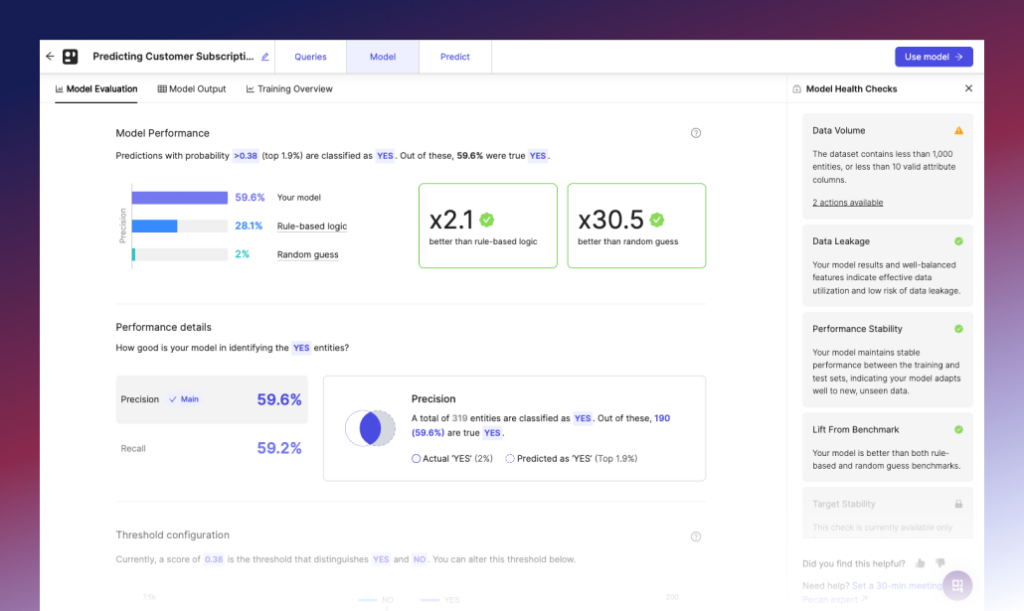
Pecan is the leading low-code AI for predictive analytics. While most platforms require a development team to function, Pecan enables non-techies to forecast business outcomes with ease. Our software’s capabilities allow you to create a model just by asking a question to the predictive agent, which will automatically generate SQL code to kick off the modeling process.
Pecan AI features:
- Automated data preparation for machine learning
- Predictive AI model building
- Model monitoring
- Actionable predictions for specific business goals
- Customizable templates for predictive models like conversion, LTV, and customer churn.
Pecan AI integrations:
- Salesforce
- Oracle
- Snowflake
- Amazon S3
- IBM Db2
- Singular
- AppsFlyer
- Firebase
- Adjust
- Google BigQuery
- PostgreSQL
- Microsoft SQL Server
Pricing for Pecan AI starts from $760 per month when billed annually.
What Pecan AI is great at:
- Fast modeling and data integration
- AI automation for predictive modeling processes
- Low-code AI interface, great for non-techies or small teams
- Easy predictive ML implementation
- Automated data prep, model building, deployment, feature engineering, and model monitoring
- No need for an in-house data scientist
- Customizable model templates
- Hyper-specific predictions for goals
- Diverse use cases handling
2. Qlik Cloud Analytics
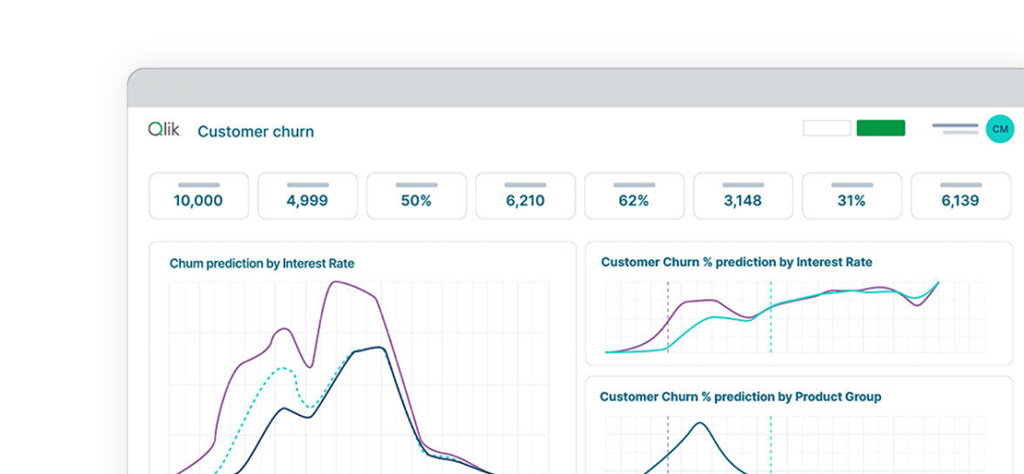
Qlik Cloud Analytics is a cloud-based analytics platform for dashboards, AI-driven insights, and workflow automation. The platform combines self-service analytics, AutoML, generative AI features, and no-code automation in a single cloud environment.
Qlik Cloud Analytics features:
- AI-powered analytics
- Interactive dashboards
- Predictive AI
- AutoML
- Generative AI through Qlik Answers
- Automated report generation
- Support of data sources through standard connectors
Qlik Cloud Analytics integrations:
- AWS
- Snowflake
- Databricks
- Google Cloud services
- Microsoft data services
- SAP
- Other application sources through Qlik’s connector
Pricing for Qlik Cloud Analytics begins at $300 per month for 10 users, billed annually. A free trial is available.
Qlik Cloud Analytics pros:
- AI-powered dashboards
- No-code workflow automation
- Cloud-based collaboration
Qlik Cloud Analytics cons:
- Pricing can rise quickly as teams scale
- Navigation can feel less intuitive for new users
3. SAS Viya
SAS is a global software company that offers a variety of predictive analytics tools, now presented as SAS Viya. The platform supports interactive data exploration, predictive modeling, open code development in languages such as Python and R, and cloud-native deployment.
SAS Viya features:
- Data exploration
- Predictive modeling
- Visualization dashboards
- Open code development in Python and R
- Cloud-native deployment
SAS Viya integrations include open-source integrations via various APIs, allowing you to align the software with your current technology setup.
Pricing for SAS Viya is available upon request.
SAS Viya pros:
- Processing large volumes of data
- Interactive data exploration
- Building predictive and machine learning models
- Supporting both visual and code-based workflows
SAS Viya cons:
- Pricing can run high for many teams
- Longer setup time
4. Oracle Crystal Ball
Oracle is one of the biggest software companies in the world, known for its wide array of products, and if you like Excel, then you’ll love Crystal Ball. Oracle designed Crystal Ball to be a dedicated app for forecasting, optimization, and simulation, allowing data and business leaders to predict outcomes through various spreadsheets.
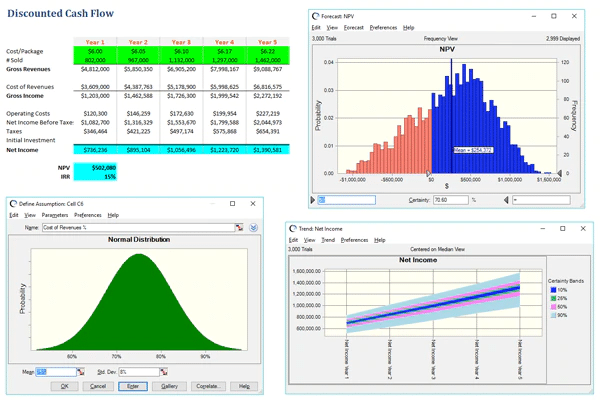
Oracle Crystal Ball features:
- Data visualizations
- Decision Optimizer developer kit
- Report generation
- Time-series forecasting
- Monte Carlo simulations.
Oracle Crystal Ball integrations include Excel.
Pricing for Oracle Crystal Ball starts at $1,210 for a single purchase ($455 for students or faculty), with a free trial.
Oracle Crystal Ball pros:
- Spreadsheet integration
- Classroom edition for the academic community
- User-friendly interface
- Low barrier to entry
- Easy-to-read data visualization
Oracle Crystal Ball cons:
- Excel version crashes occasionally
- UI looks a bit outdated for some users
5. Alteryx
Alteryx is an all-in-one, self-service predictive analytics platform with forecasting capabilities and automation features. It pulls data from multiple sources and tools to give teams business insights without requiring coding experience.
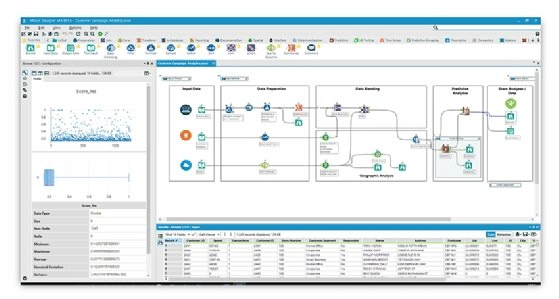
Alteryx features:
- Code-free data prep and blending
- Drag-and-drop interface for analytics
- AI-powered analytics
- Alteryx Copilot
Alteryx integrations:
- Amazon S3
- Google BigQuery
- Snowflake
- Salesforce
- Shopify
- HubSpot
- Mailchimp
- Google Analytics
- Excel
Pricing for Alteryx begins at $250 per user/month when billed annually.
Alteryx pros:
- Over 80 native integrations
- Drag-and-drop workflow experience for analysts
- Reusable macros and automation
- Strong analyst community
- Visual data prep and blending
Alteryx cons:
- Expensive compared to other tools
- Not the best data visualization
6. IBM SPSS Statistics
IBM SPSS is a statistical analysis tool with roots in the social sciences. It has evolved into a predictive analytics platform, offering statistical rigor for teams that require data validation and manipulation.
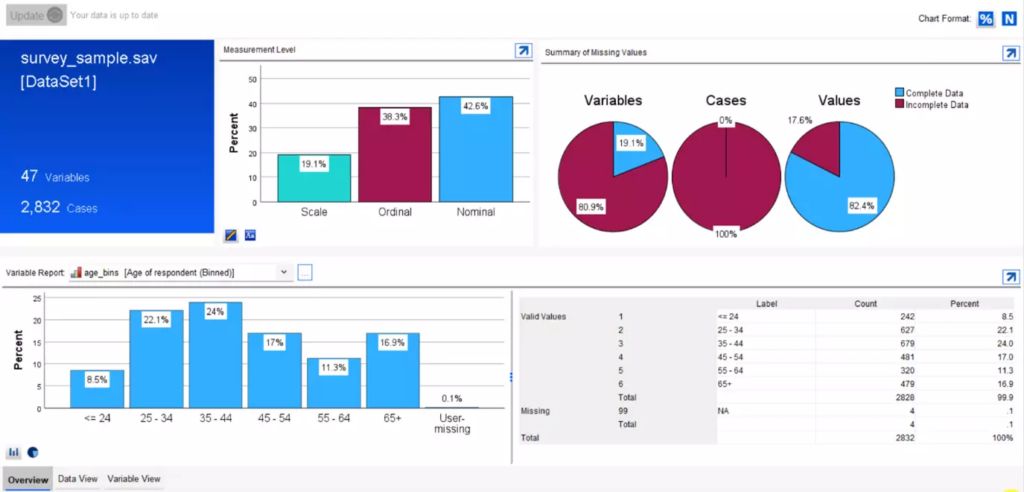
IBM SPSS Statistics features:
- Advanced statistical procedures
- Data preparation tools
- Syntax command language
- Custom table generation
- Direct marketing modules
IBM SPSS Statistics integrations include Microsoft Office, SQL databases, Python, R, and open-source data formats.
Pricing for IBM SPSS Statistics goes from $105 per user/month.
IBM SPSS Statistics pros:
- Statistical accuracy and depth
- Proven reliability for research and clinical data
- Comprehensive data cleaning functions
- Extensive library of specialized plug-ins
IBM SPSS Statistics cons:
- Dated user interface aesthetics
- Steep learning curve for non-statisticians
7. DataRobot
DataRobot is an automated machine learning (AutoML) tool that enables teams to build, deploy, and manage models at scale. The platform is an option for organizations that need an MLOps framework to monitor model health and bias.
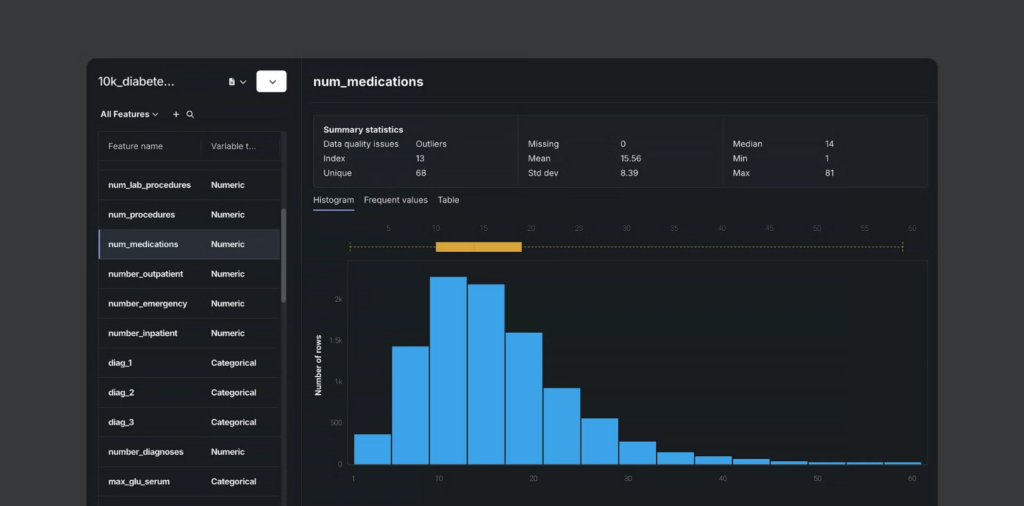
DataRobot features:
- Machine learning (AutoML) workflows
- Model health monitoring
- Bias detection tools
- Time-series forecasting
- No-code app builders
DataRobot integrations:
- Snowflake
- AWS
- Google Cloud Platform
- Microsoft Azure
- SAP
Pricing for DataRobot is available upon request for enterprises.
DataRobot pros:
- Rapid model prototyping
- Enterprise-grade model governance
- Clear model interpretability
- Scalable MLOps infrastructure
DataRobot cons:
- High cost for smaller teams
- Complex initial environment setup
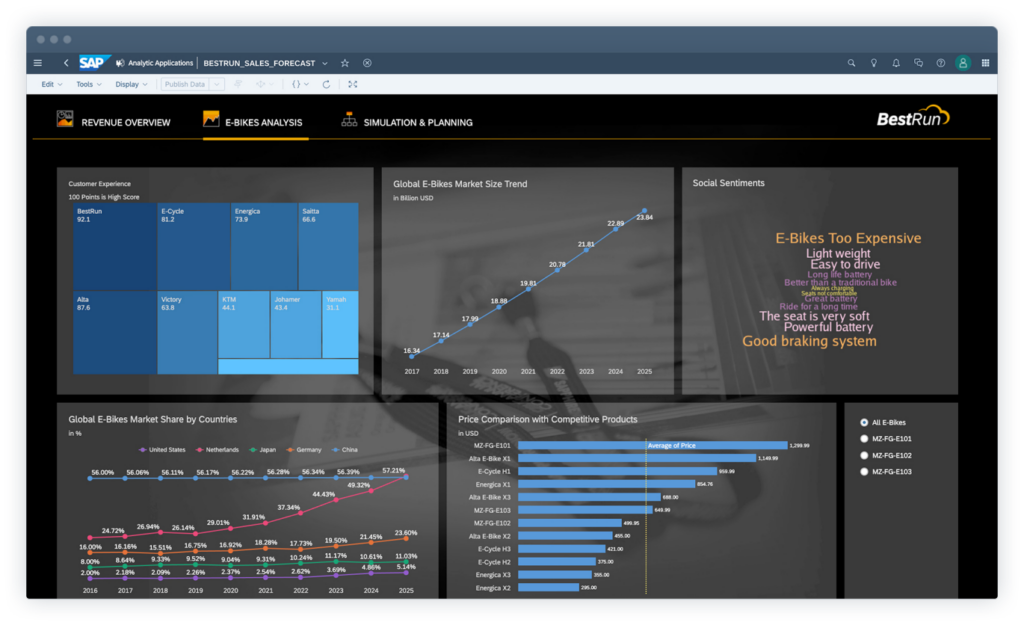
8. SAP Analytics Cloud
SAP Analytics Cloud combines business intelligence, augmented analytics, and enterprise planning into a cloud environment, connecting predictive insights to financial planning and operational goals. For businesses inside the SAP ecosystem, this feature allows users to ask questions in plain language to generate instant visualizations on their platforms.
SAP Analytics Cloud features:
- Natural language processing (NLP) search
- Automated discovery tools
- Integrated financial planning
- “What-if” simulation builders
- Story-based data design
SAP Analytics Cloud integrations:
- SAP S/4HANA
- Salesforce
- Google Drive
- SQL databases
Pricing for SAP Analytics Cloud goes from $36 per user/month.
SAP Analytics Cloud pros:
- Real-time access to SAP data
- Alignment between predictions and financial plans
- Self-service data exploration
- Enterprise-wide collaboration features
SAP Analytics Cloud cons:
- High complexity for non-SAP data sources
- Limited advanced modeling compared to specialized AI tools
9. Tableau
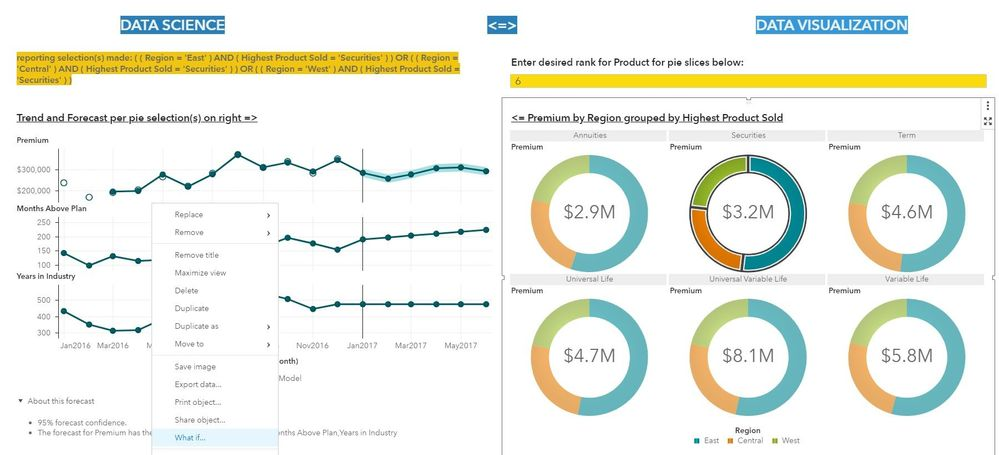
Tableau is a data visualization solution made for freelancers to enterprise organizations. The tool has been on the market since 2003, when Stanford researchers developed it as part of a computer science project. Even though Tableau makes data visualization its core solution, the web- and cloud-based platform includes predictive analytics capabilities for an extra cost, drawing on parent company Salesforce’s Einstein AI.
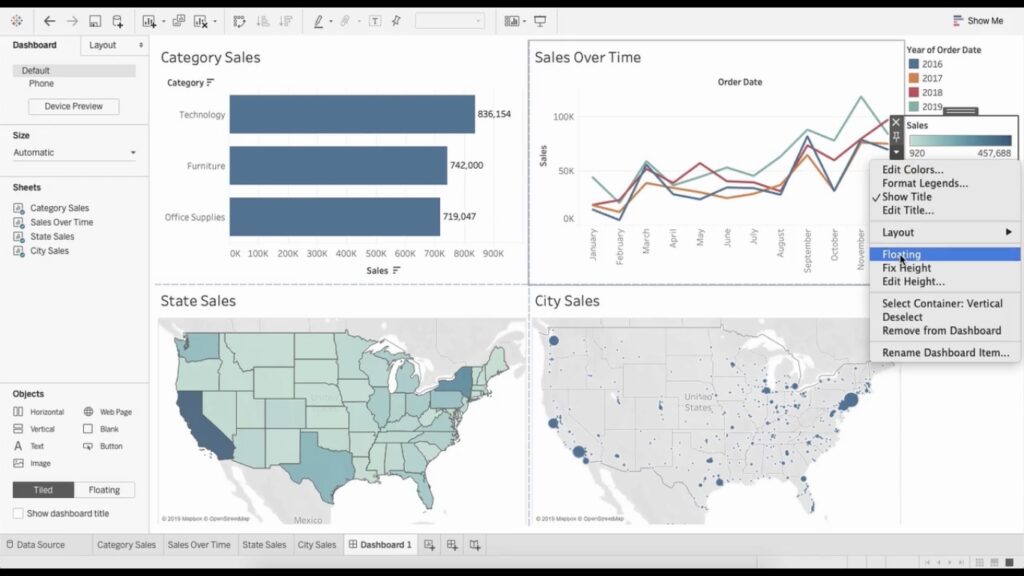
Tableau features:
- Data discovery, visualization, and interpretation, along with big data services
- Collaboration tools
- Automated modeling
- A reporting interface, dashboards, and on-premises servers
Tableau integrations:
- Amazon Redshift
- PostgreSQL
- Splunk
- Salesforce
- Snowflake
- Google Analytics
- Amazon Athena
- Google BigQuery
- Vertica
Pricing for Tableau starts at $15 per user/month for “viewers only.” To use the predictive analytics tools within Tableau, you’ll need the “creator” license ($75+) plus the Einstein Discovery layer, which requires separate Salesforce licensing.
What Tableau pros:
- Clear, interactive visualizations
- Drag-and-drop dashboard building
- Fast visual exploration of data
- Access across desktop, web, and mobile
Tableau cons:
- Steep learning curve
- The mobile app has limited features
What are the most used techniques in predictive analytics?
Among the most widely used methods for predictive analytics are decision trees, regression, and neural networks, each offering unique advantages in different scenarios.
- Regression analysis: An approach for measuring how independent variables relate to an outcome. Linear models support predictions for continuous values such as revenue or demand, while logistic models support predictions for binary outcomes such as churn or conversion.
- Decision trees: A rule-based technique for mapping how different conditions lead to different outcomes. This approach is useful for classification, risk analysis, and customer segmentation.
- Random forests: An ensemble method that combines multiple decision trees to improve accuracy and reduce overfitting. Random forests are good choices for use cases such as churn prediction, fraud detection, and demand forecasting.
- Time-series modeling: A forecasting method based on historical data over time. Strong fit for sales planning, inventory management, staffing, and seasonality analysis makes the time-series approach popular across industries.
- Classification models: A category-based approach for sorting records into predefined groups, such as likely to buy, likely to churn, or likely to default. Clear outputs support targeted action and sharper prioritization.
- Clustering: A segmentation method for grouping similar records based on shared characteristics. Useful support for customer segmentation, pattern discovery, and more precise predictive modeling.
- Neural networks: A pattern-detection technique designed for large and complex datasets. Strong fit for recommendation engines, image recognition, and advanced forecasting use cases.
Read our complete guide on predictive analytics techniques.
Benefits of adopting predictive analytics software
According to Fortune Business Insights, the global predictive analytics market will reach $67.66 billion by 2030, growing at a compound annual growth rate (CAGR) of 24.4%. This type of prediction software has become part of business strategy, as companies that invest in these tools can now predict customer behavior, increase sales, and optimize their marketing strategies.
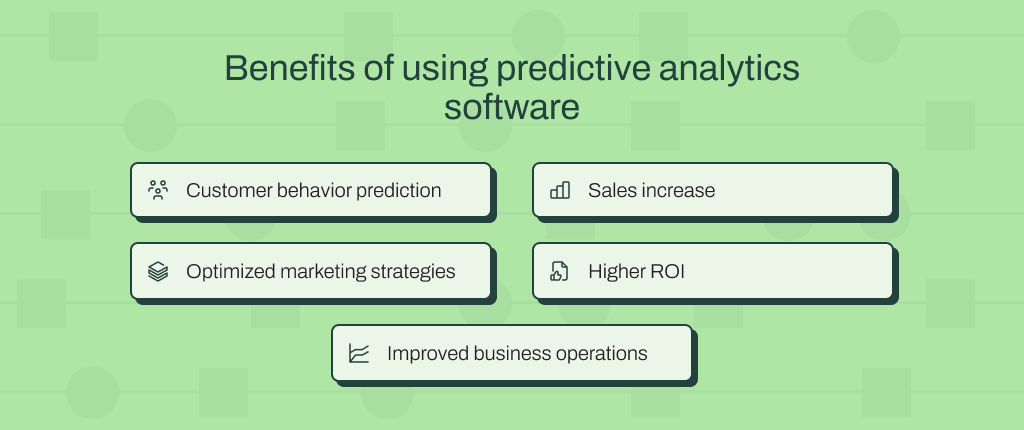
See the five main benefits you get from using predictive software.
1. Customer behavior prediction
To grow your business, you need to reach your target market effectively. But if you don’t know your audience, your competitors who do know them will win them over.
One of the biggest benefits of using a tool for predictive analytics is better understanding your customers. By leveraging historical data and predictive techniques through a platform, you’ll gain actionable insights into your clients’ past and future behaviors and how they change throughout the customer journey.
With that knowledge, you’ll be better able to spot potential roadblocks in your business and especially your customer engagement efforts, so you can improve your marketing strategy – quite useful to retain or re-engage your buyers.
Read about customer behavior analysis.
2. Sales increase
A predictive analytics platform can help you identify products and services your customers have bought from you in the past and use this sort of historical data to predict what they might need in the future.
Understanding past purchase behavior helps you identify which customers are most likely to be interested in upsell and cross-sell offers to provide more value, generate repeat purchases, and improve average order value.
3. Optimized marketing strategies
Predictive analytics solutions allow you to anticipate customers’ lifetime value early, as soon as 24 to 48 hours after launching a new marketing campaign on some platforms. With that information, you can discover the likely return on ad spend (ROAS) by predicting and aggregating customer lifetime value – one, three, six, or more months out.
Learn how campaign management improves marketing ROI.
4. Higher ROI
Get ready to not only convert customers more quickly but also encourage them to spend more during their time with you. Overall, predictive monitoring tools can deliver a greater return on investment (ROI) for your user acquisition campaigns and retention efforts.
Predictive analytics tools translate into higher ROI when they:
- Help convert more leads into customers by showing which prospects are ready to buy, so you direct your budget to the people with the highest conversion potential.
- Encourage repeat purchases, as predictive tools show which customers are most likely to buy again, so you can time your campaigns and offers more effectively.
- Increase average order value when identifying which clients are willing to spend more, helping you tailor upsell and cross-sell efforts to the right audience.
- Reduce your churn rate by pointing out who’s more likely to stop buying from you.
5. Improved business operations
The benefits of using predictive analytics software extend to operational efficiency: McKinsey reported that forecasting engines using AI can automate up to 50% workforce-management tasks, such as planning and reviewing performance.
With AI forecasting and analytics, you call for fast, agile actions anticipated by predictive models, so you can be preventive instead of just reacting to shifts in your operations.
Meet the predictive analytics platform that leverages AI to level up your business
If you’re struggling to optimize business outcomes in marketing, supply chain, sales, customer service, or elsewhere in your organization, predictive analytics in general can be a game-changer. But if you’re looking for an AI-driven predictive analytics platform that doesn’t require expert data scientists or developers to get your models running, then you’ll want to check out Pecan AI.
With Pecan, you can:
- Tell in plain English what you want to achieve, and watch as our predictive AI agent builds a model for you.
- Plug into your data warehouse and let us handle all the data prep and feature engineering for your predictions.
- Go from messy data to a live, working model in weeks, not months.
- Get details on how your model is performing, no AI black box, no mysteries.
- Send predictions straight to your CRM or marketing tools through Pecan’s integrations, so you can take action without changing tabs.
Dive into one of the best predictive analytics tools right away: Let us give you a guided Pecan demo.


Team Pecan is what happens when you put a bunch of data geeks in a room and tell them to make machine learning suck less. We’ve built models, broken models, fixed models, and occasionally questioned our life choices at 2am debugging feature pipelines. Now we write about it so you don’t have to learn the hard way. Think of us as your slightly unhinged data science friends who actually want you to succeed.