In a nutshell:
- Predictive modeling uses historical data to estimate what happens next: which customer churns, which lead converts, how many units a store sells next month.
- The main types of predictive models are classification, regression and time series forecasting. Clustering supports them but doesn’t predict an outcome on its own.
- Every model follows the same loop: define the question, gather and prepare data, train, validate, deploy, monitor.
- The failures that sink projects (data leakage, overfitting, model drift) come from the data and the question far more often than from the algorithm.
- AI now automates most of that loop, which is how Pecan’s Predictive AI Agent gets from your historical data to live predictions.
Most guides to predictive modeling spend their best pages on algorithms. We’d rather spend ours on the question. A predictive model is a precise question about the future (which customer, what outcome, by when) answered with historical data, and the algorithm is the last decision in that process. Usually the least important one, too. Get the question right and most algorithms will give you something you can act on. Get it wrong and the best algorithm in the world will hand you a very precise answer to the wrong question.
That idea runs through everything below: the model types, the examples, the build loop, the metrics, and the part where AI took over most of the work.

What is predictive modeling?
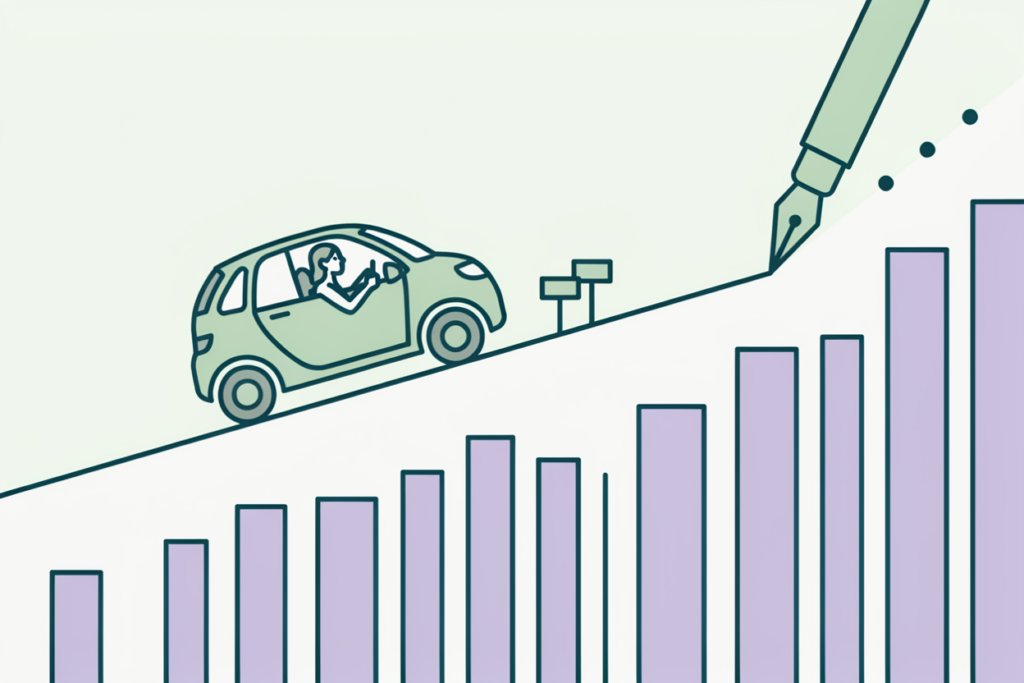
Predictive modeling is the process of using historical data to build a statistical or machine learning model that estimates a future outcome, such as whether a customer will churn, how much a lead is worth or how many units will sell next month. The model learns patterns from past examples and applies them to new ones.
Where AI fits: machine learning supplies the algorithms that do the learning, and AI increasingly does the work around them too, from preparing the data to deciding which features carry signal. When people search for “predictive AI,” this is what they mean. It’s AI whose job is to estimate what will happen, as opposed to generative AI, whose job is to produce text, images or code.
You’ll also see the term predictor model. It’s the same thing named from the other end: a model built from predictors, the input variables (last login, order count, plan tier) that carry the signal about the outcome.
Predictive modeling vs predictive analytics vs machine learning
Three terms, three different sizes.
| Predictive analytics | Predictive modeling | Machine learning | |
| What it is | The business practice of using data to anticipate outcomes and act on them | The technical process of building the model that produces a prediction | A family of algorithms that learn patterns from data |
| Scope | Question, model, decision, measurement | Historical data to a trained, validated model | The learning method inside the model |
| Example | A retention program driven by churn scores | Building the churn model | Gradient boosting that scores churn risk |
Predictive analytics is the whole program: the question, the model, the decision and the measurement. Predictive modeling is the part where you build the model. Machine learning is one way to build it, and today it’s nearly always the way. You can do predictive modeling with a plain regression and no machine learning at all, and you can use machine learning for jobs that don’t predict anything, like grouping customers by behavior. If you want the longer version of where the first and third terms overlap, our comparison of predictive analytics vs machine learning covers it.
Types of predictive models
Classification, regression and time series forecasting do almost all the predictive work in business, and the shape of the answer you need tells you which one you’re building. A fourth technique, clustering, shows up in most lists of predictive modeling techniques and deserves a spot here with an asterisk.
| Type | Question it answers | Business example | Common algorithms |
| Classification | Will this happen, yes or no? (Or which category?) | Will this customer churn in the next 60 days? | Logistic regression, random forest, gradient boosted trees (XGBoost, LightGBM, CatBoost), neural networks |
| Regression | How much? | What will this customer spend over the next 12 months? | Linear regression, gradient boosted trees, random forest, neural networks |
| Time series forecasting | How many, per period, going forward? | How many units of this SKU will this store sell each week next quarter? | ARIMA, exponential smoothing (Holt-Winters), gradient boosted trees with lag features, neural networks |
| Clustering (supporting step) | Which records are similar to each other? | Which customers behave alike, before we predict anything about them? | K-means, hierarchical clustering, DBSCAN |
Classification answers yes/no questions, or sorts records into categories. The output is usually a probability (an 82% chance this customer churns) that you turn into an action with a threshold. Logistic regression is the baseline every team should build first because it’s fast and easy to explain. Gradient boosted trees win most contests on tabular business data, which is why XGBoost and LightGBM show up in so many production churn and fraud models.
Regression answers “how much” with a number: lifetime value, next order size, days until the next purchase. The algorithms overlap heavily with classification (a gradient boosted tree can do either), and the metrics come back in units you can argue about in a budget meeting.
Time series forecasting is regression with time as the spine. The model has to respect seasonality, trend and the fact that last week’s sales tell you something about this week’s. ARIMA and Holt-Winters are the classic tools and still fine for stable products. When demand depends on drivers like promotions, price and weather, gradient boosted trees fed with lag features and those drivers usually beat the classics.
Clustering is the asterisk. It’s unsupervised, which means it has no target, no outcome to be right or wrong about. It groups records that look alike (k-means and hierarchical clustering are the common methods) and it’s useful to predictive modeling as a feature (a segment ID the model can use) or as a way to split one population into groups that each get their own model. On its own it tells you who’s alike, not what they’ll do. (We used to list it as a fourth predictive model type. We were being generous.)

Predictive modeling examples
These five use cases account for most of the predictive models in production at mid-market and enterprise companies. Each one is written as the question the model answers, because that’s where every good model starts.
Customer churn. Which customers will cancel in the next 60 days? A classification model trained on usage, billing, support and tenure history scores every active customer, and the retention team works the top of the list. The algorithm matters less than three other choices: how you define churn, how far ahead you predict, and whether anything from the future leaked into training. Our comparison of ML models for predicting churn ranks the algorithms and then makes the case for caring less about the ranking.
Customer lifetime value. How much will this customer be worth over the next 12 months? A regression model, and the useful version answers within days of acquisition, while there’s still time to decide how much to spend on that customer. That early-estimate version is predicted lifetime value, or pLTV, and it’s the model that decides marketing budgets at most subscription and app companies.
Lead scoring. Which of this month’s leads will convert within 90 days? Classification again, replacing the points-based rules most CRMs ship with. A propensity model built on past leads learns which combinations of firmographics, source and early engagement preceded a closed deal, and sales works the leads in that order.
Demand forecasting. How many units of each SKU will each location sell each week? Time series forecasting, with promotions, price changes and sometimes weather as drivers. The forecast feeds purchase orders and staffing, so a few points of demand forecasting accuracy show up directly as fewer stockouts and less dead stock.
Fraud detection. Which transactions, disputes or sign-ups are fraudulent? Classification with a twist: the positives are rare, so a model can look great on accuracy while catching nothing. Precision against a random baseline is the number that matters, and models for fraud and chargeback prevention are judged on how much of the flagged list is real.
Notice the shape all five share: an entity (customer, lead, SKU, transaction), an outcome, a time window, and a decision waiting on the other side. That shape is the model. The algorithm is how you compute it.
How to build a predictive model, step by step
Seven steps. The last one points back to the first, which is why it’s a loop rather than a project with an end date.
- Define the question. Entity, outcome, time window, decision. “Which customers (entity) will churn (outcome) in the next 60 days (window), so we can call the 500 highest-risk accounts (decision).” Vague questions (“how do we reduce churn?”) can’t be modeled. Precise ones can.
- Gather the data. Everything that existed about the entity at the moment of prediction: CRM fields, product usage, billing, support tickets, orders. Real-world data is messy, and that’s fine. The model needs the right tables far more than it needs spotless ones.
- Prepare and engineer features. Turn raw events into signals: logins in the last 7 days, days since last order, severity mix of recent tickets, trend in weekly spend. This step decides most of a model’s accuracy, more than the algorithm will.
- Train. Split the history into training, validation and test sets. The algorithm learns the relationship between features and outcome on the training set. In practice several algorithms get tried and the best performer on the validation set wins.
- Validate. Score the held-out test set and compare with benchmarks: a random guess and a simple rule. Check for leakage (a churn model with 0.99 AUC is usually a leak, not a triumph) and for overfitting (great on training, poor on test).
- Deploy. Score new records on a schedule and deliver the predictions where the decision happens: the CRM, the warehouse, the planning tool. A prediction that lives in a notebook changes nothing.
- Monitor and retrain. Compare predictions with outcomes as they arrive, watch the inputs for drift, and retrain when the business changes. Then go back to step one, because the question tends to change too.
Until a few years ago, “AI” in this loop meant step four. Today it does steps two through seven, and the person who owns the question does step one.

How to evaluate a predictive model
A model’s score only means something next to an alternative, so read every metric below with the question “compared with what?” in the back of your mind.
For classification models:
- AUC measures how well the model ranks positives above negatives. 0.5 is a coin flip, 1.0 is perfect, and anything suspiciously close to 1.0 deserves a leakage check.
- Precision is the share of the customers you flagged who were right. High precision means fewer wasted retention calls.
- Recall is the share of the customers who churned that you caught. High recall means fewer surprises.
- Lift compares the top of your list with a random pick. If the top 10% of scores contains four times the average churn rate, lift at the top decile is 4.
- Calibration asks whether a 70% score means 70%. It matters whenever the probability itself drives a decision, like how much to spend on a save offer.
For forecasts, MAPE is the average percentage error across periods, and WMAPE weights that error by volume so your biggest SKUs count for more than the long tail. Both are easy to explain to a planner, which is most of their value.
Then the benchmarks. Say 2% of transactions are fraudulent. Picking transactions at random gives you 2% precision. A rule-based filter might reach 10%. A trained model that reaches 40% precision sounds mediocre out of context and is in fact 20 times better than guessing and four times better than the rules. Judge the model against the alternative your team would otherwise use, pick the one metric that matches the action, and report that one.

How AI is changing predictive modeling
AI has changed predictive modeling in three ways, and the newest one matters most.
AutoML made the algorithm a non-decision. Automated model selection tries several algorithms and dozens of hyperparameter settings, scores each on validation data and keeps the winner. The part of predictive modeling that used to take a specialist a week is now a background task, which is a large part of why we say the algorithm is the last and least important choice.
Automated feature engineering moved the accuracy. This is the bigger deal. Given raw tables (orders, events, tickets), AI can build hundreds of candidate features (counts, trends, recency, ratios over different windows) and test which ones carry signal. Since feature engineering is where most of a model’s accuracy lives, automating it changes what a small team can build.
Predictive AI agents took over the loop. The newest shift. A predictive AI agent takes the business question and runs the whole build loop from step two onward: it reads your historical data, builds the training set, engineers features, trains and validates with guardrails for leakage and overfitting, deploys the predictions into your systems and monitors them for drift. What people call AI predictive modeling in 2026 is mostly this: predictive AI models built and run by an agent, with a person at the start (the question) and at the end (the decision).
Some things haven’t changed. The question still has to be precise. The data still has to be what was known at prediction time. And somebody still has to own the decision the prediction feeds, because a churn score nobody acts on is just a well-informed shrug.
Common predictive modeling mistakes
Most models that look great in a slide deck and fail in production fail for one of three reasons. Each has a distinct tell, and each shows up at a different point in the loop.
Data leakage. The model trains on information that won’t exist at prediction time: an “account closed” date in a churn model, a “has withdrawn” flag in a model predicting first deposits. It looks brilliant in testing and collapses on live data. The tell is validation results that are too good. The fix is documenting when every field becomes known and excluding anything that’s filled in after the moment of prediction. Our post on data leakage walks through the deposit example in detail.
Overfitting. The model memorized its training data, noise and all, instead of learning the pattern. The tell is a big gap between training performance and test performance. The fix is more data, fewer noisy features and honest validation on records the model never saw. There’s a longer explanation in our post on overfitting.
Model drift. The model was right at launch and got worse as the business changed: a pricing change, a new channel, a renamed field. The tell is accuracy that erodes over months with no change to the model. The fix is monitoring inputs and outcomes, and retraining on a cadence that matches your rate of change, which our guide to model drift lays out step by step.
A fourth, quieter mistake: answering a question nobody can act on. A churn model that flags customers the day they cancel is perfectly accurate and completely useless. Build in the lead time your team needs to do something.

Predictive modeling with Pecan
You bring the business question and your historical data, as it is. The Predictive AI Agent reads that data, builds the training set, engineers the features, trains and validates the model with health checks for leakage, overfitting, benchmarks and target drift, and puts predictions live in the tools your team already uses: your CRM, your warehouse, your planning tool. We own the outcome, and the predictions stay accurate as your business changes, because monitoring and retraining happen in the same place the model was built.
The use cases above are the ones we deliver most often: churn and winback for retention teams, lead scoring and conversion for sales and growth, LTV and campaign ROAS for marketing, demand forecasting for operations and planning. Here’s how Pecan helped CAA Club Group to enhance service quality, reduce time spent forecasting by 30%, and boost member satisfaction throughout the entire service region, all while increasing the efficiency of their in-house data team.
If there’s a question about next quarter that your team keeps answering by hand, book a demo and we’ll walk you through how predictive modeling answers it on data like yours.
What is an example of predictive modeling?
Can AI do predictive modeling?
What does predictive modelling mean?
Is predictive modeling the same as forecasting?
What is a predictor model?